Home Monitoring Solutions
Ottawa was hit with a harsh winter in 2022-23. So much so that Hydro Ottawa actually ranked the top five worst outages, two of them were weather related! Durring the worst outage I needed to work and stay warm so I packed up the dog and we went to a friend’s house. While there I didn’t have a reliable way of confirming if the power had been restored back home. Of course I could check the outage map but that was unreliably updated with relivant data. So I decided to look into how I could go about monitoring that kind of information.
I of course had some basic requierments for this project. First, I wanted to be able to monitor more than just if the power was on. I already have a small private service running that faces the internet so that was easy to check. But I wanted to be able to tell how long the power had been out based on system uptime as well as run basic ping and netcat checks on my internal services. The monitoring service also needs to be super light weight, small enough to run on a Raspberry Pi 2 which is my home web server. This means no Nagios or other heavy application. I could look into some Docker containers but those are typically also too heavy for a Pi2 already running some small services at home. I also only need to check less than 10 services based on one command. I didn’t need complicated statistics collected.
That’s when I stumbled accross Cyclenerd/Static Status which is a small project that solves this problem quite well! This project hit all of the big asks, the most important being that it’s light weight! It’s a bash script! This project is great, it’s able to run basic commands as well as complicated scripts and report back a binary up or down status. It’s also able to track outages that occour to the service so I have some basic history if I need to diognose a complicated problem.
So, I decided to download it and start using it on my web server. The output is a simple HTML file, colour indicator image as well as a optional JSON file if you want a computer to be able to consume the data. I configued some basic services and started to manually run the script. I was able to easily get it to monitor some Cloudflare redirects, my GitHub Pages sites and some local services that I run. I found that some of the commands are not implemented super well and I needed to use a different method to check them, but I was able to get monitoring down.
However, I did open a feature request issue with the project as I found the binary response to be super limiting. I wanted to be able to report the system uptime, not just if the system was up or down. While I think this is a good idea, it might be out of the scope of the project. I was able to implement my own hacked-together version of this by adding a new section to the page by running the uptime --pretty command. This fits perfectly into what I was looking for. It could also easily be expanded into more system information, or just information that isn’t the binary up/down state.
In the future, I think I would like to expand on the Static Status project and be able support displaying output from a script as well as the binary status. This could be a useful tool and would increese the features of the project. However, it’s difficult to implement this as it would likely need a compleate rewrite of the way the each status check is exectued since aditional data would need to be stored from the output of the script.
You can view my implementation of the Information section here: KyleK1782/static_status: b29d222
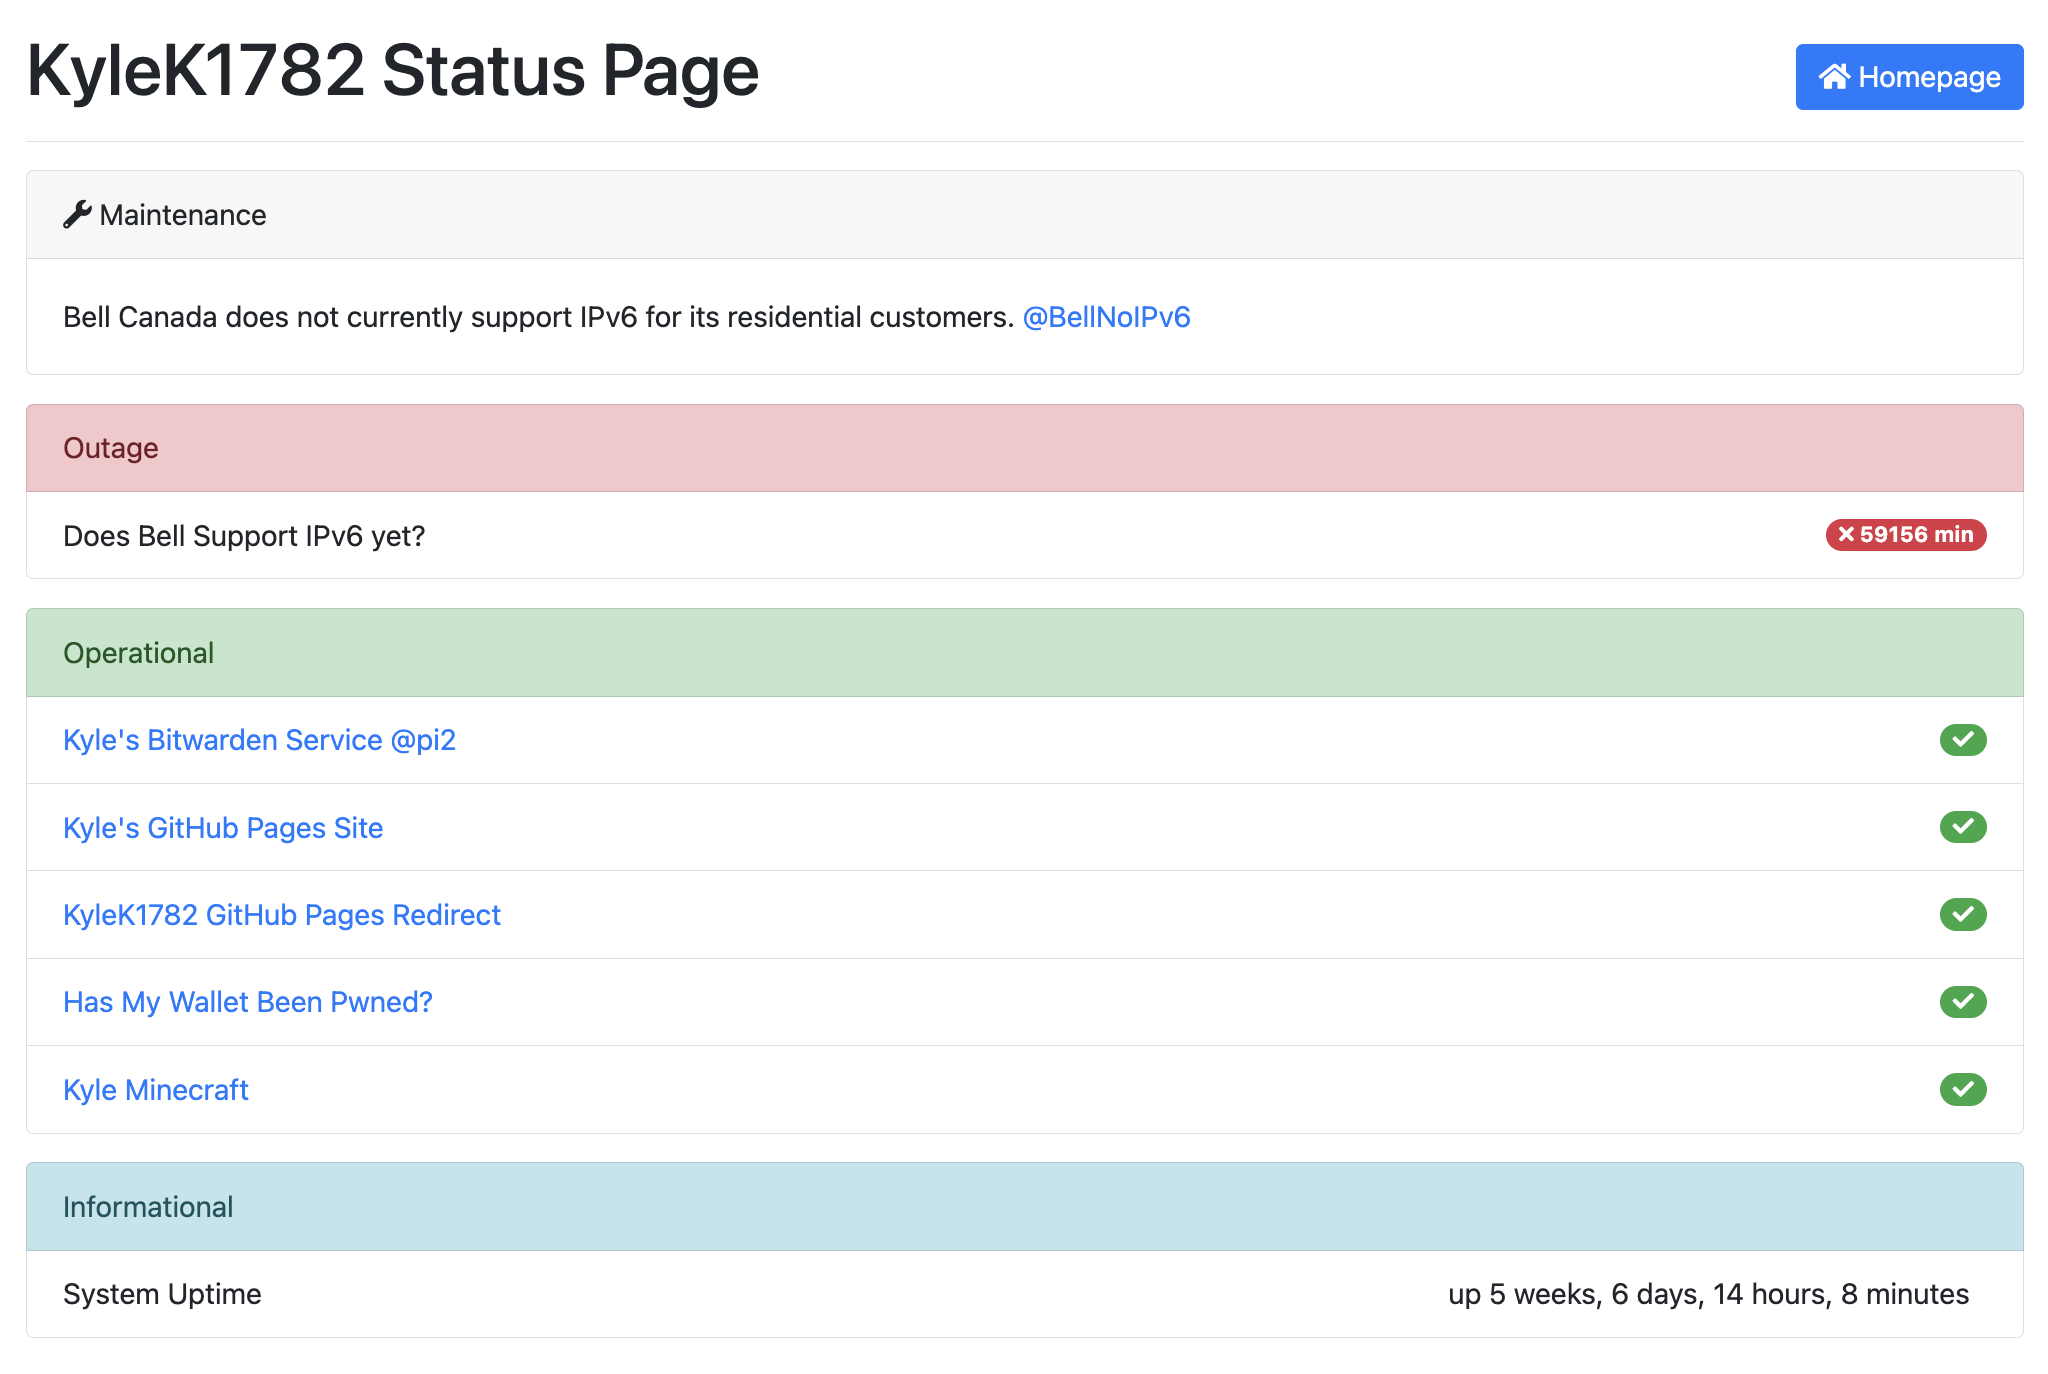
Unrelated to this, Bell, the largest ISP in Canada doesn’t support IPv6 for residential customers. @BellNoIPv6